DEBUGGING
An Art For Smart
Pushplata
BIT Mesra Alumuni
*
github.com/pushp
linkedin
What is PDB ?
- An interative debugger
- Provide stepping through source code
- Setting conditional breakpoints
- Inspecting stack trace
- Viewing source code
- Running Python code in a context
- Post-mortem debugging
Debugging methods and tools:
- Print statements
- Logging
- Pdb
- Pudb
- ipdb
- wdb
- windb
- And many more .....
Code breaks somewhere ..

Mode and Methods
- Script mode
- Run mode
- Trace mode
- pm mode
- Post-mortem
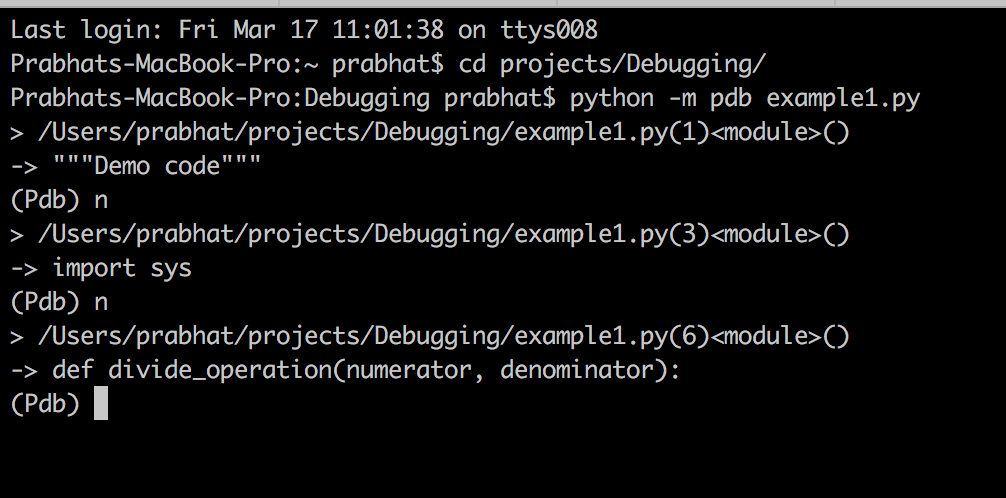
Script Mode
use -m pdb command
execute python -m pdb example1.py
Run Mode
- .run('statement')
- .runeval(expression)
- .runcall(function)
pdb.run("myobj.myfunc")
Same as run except it returns the value of evaluated code.
Trace Mode
import pdb
pdb.set_trace()
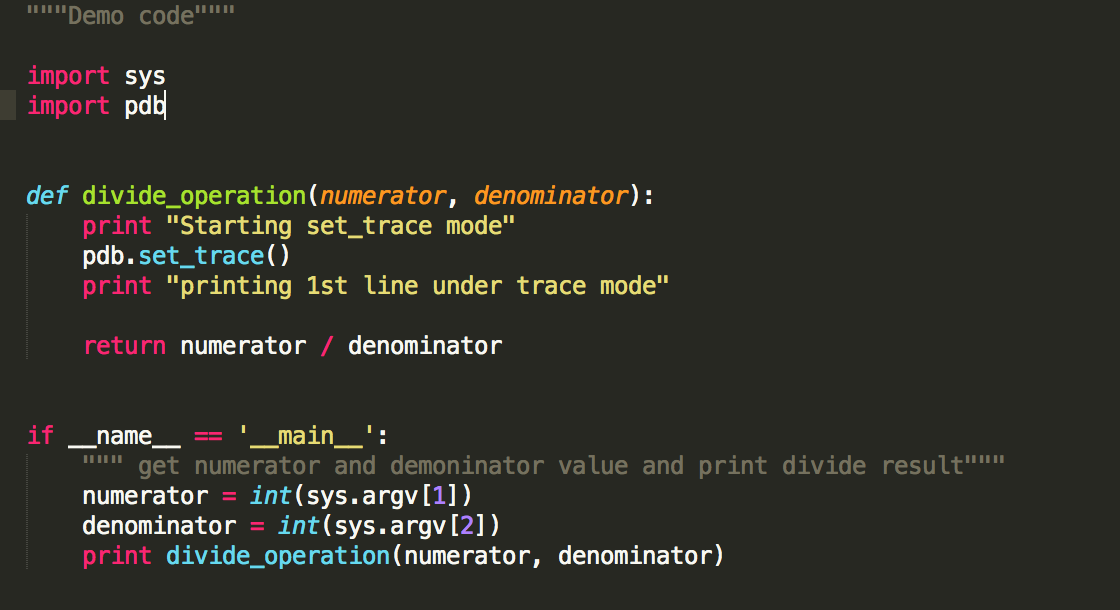
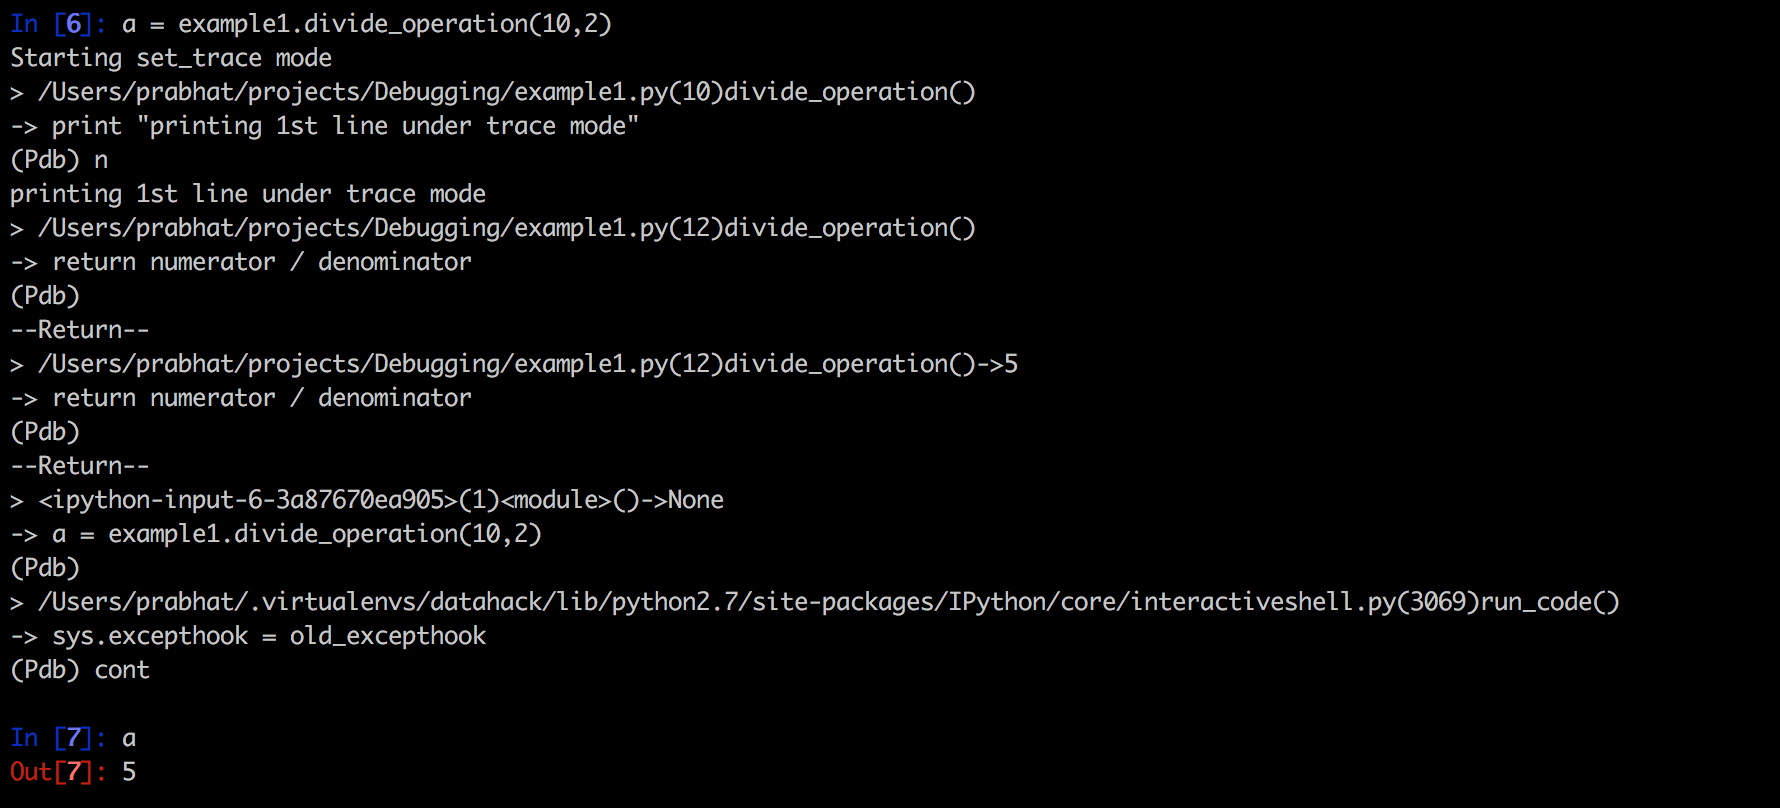
Trace Mode
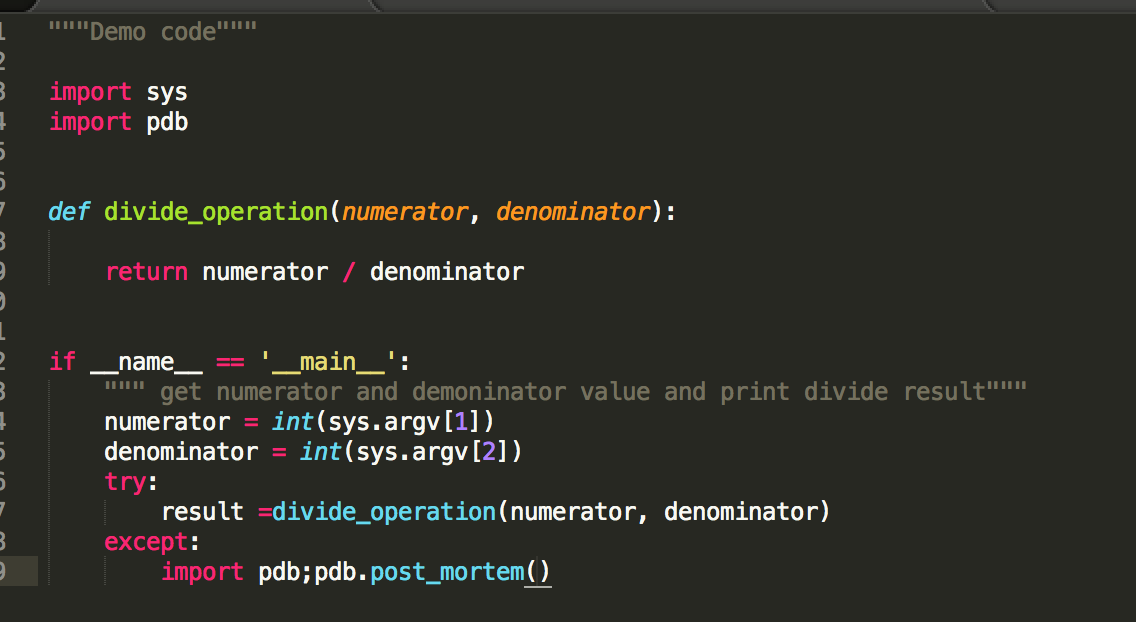
Post mortem Mode
import pdb ; pdb.post_mortem()
Basic Commands
- list
- where
- help
- quit
- whatis
- p
- pp
- args
Some error on production

Debugging give me a min !!

Commands to show flow of code
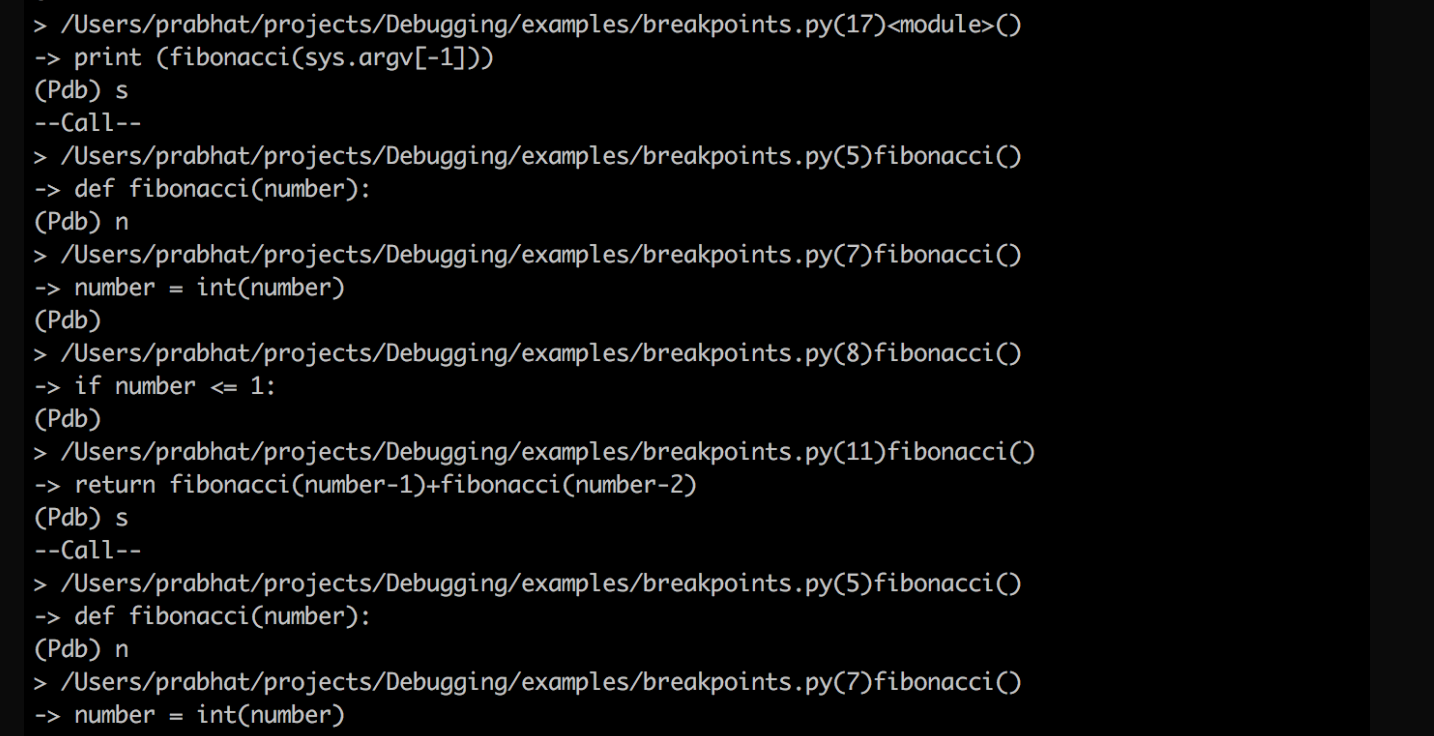
- next
- step
- continue
- return
- restart
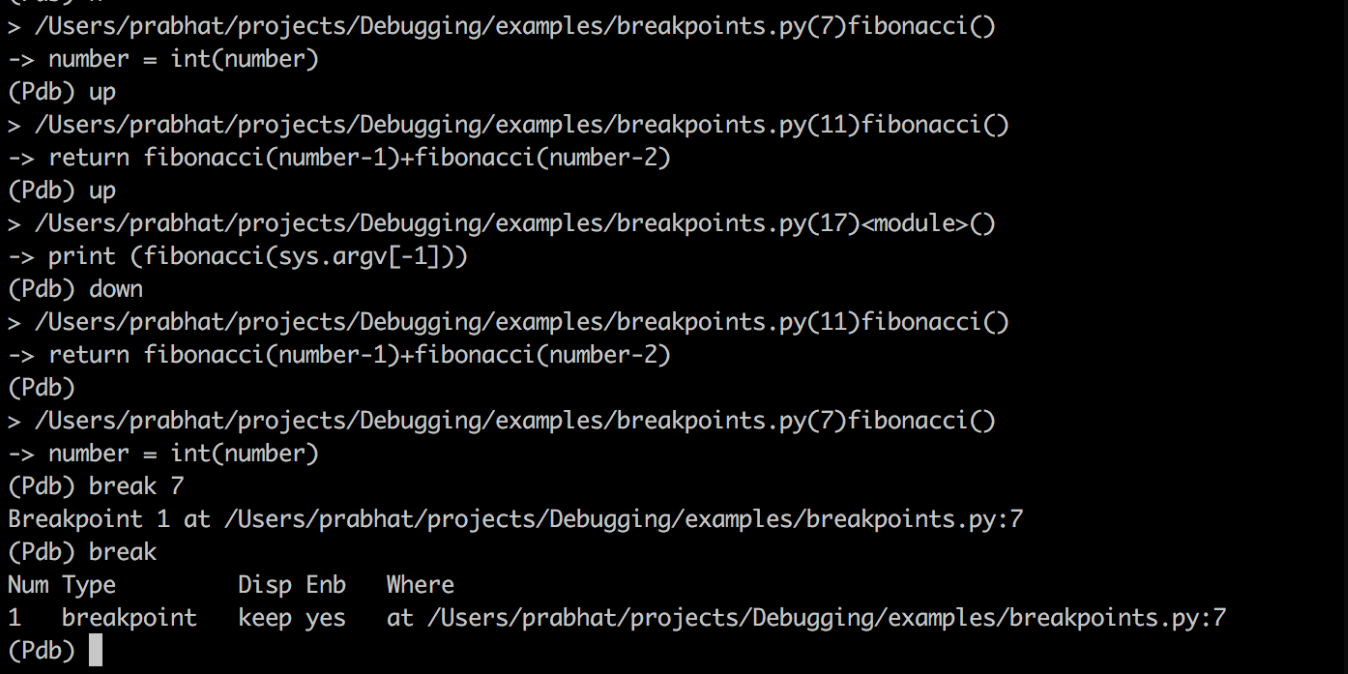
Conditional Commands
- up/down (for recursive)
- break
- condition
- enable/disable
- clear
- jump
Few more commands
- alias
- debug
- interactive
- !any python variable
Conclusion
- Easy to use
- Save time and help from last moment anxiety.
- Simple methods and commands.
- Follow pdb in your regular task.
- Magic functions.
References
Any Questions ?
Thank you !!!